2026 FIFA World Cup: Lodging Hits and Misses
Overall reports have been disappointing for several host cities, but major tests remain for New York and Los Angeles
Posted On: July 7, 2026 By :The 2026 FIFA World Cup is the largest in the history of the competition, with 16 host cities in three countries — Canada, Mexico and the United States — hosting 104 matches involving 48 teams.
Despite FIFA President Gianni Infantino‘s promise to deliver “the greatest World Cup ever” with more than 6 million fans converging for the tournament, hotels in the early going of the tournament did not appear to see the expected benefit. According to a survey of the American Hotel & Lodging Association’s members in April, 80 percent of hoteliers in the 11 U.S. host cities reported hotel bookings tracking below initial forecasts, and only a quarter of respondents said they had seen a “meaningful incremental lift.”
Now, SportsTravel has analyzed the latest major hotel and lodging trends across the host cities since play began. This includes data from the first week of the tournament (between June 11–21), compared to the same period a year earlier, and forward on-the-books data as of June 22, 2026, covering the remainder of the tournament through to the final on July 19.
Judging by the data, the impact of the World Cup on hotel bookings has been mixed, with some destinations seeing a rise in occupancy compared to the previous years and others struggling, perhaps the result of inflated rates. Overall, many destinations are reporting results that are more disappointing than expected, even if reservations are trending fractionally ahead of last year’s levels.
The difference between a positive and negative outcome can come down to several factors: which fans visit the host cities on which dates; the existing hospitality and tourism infrastructure in those destinations; and the strength of the sports (or soccer) economies.
Early Challenges for the U.S. Hotel Industry
The AHLA report, issued before the tournament began, identified five key challenges that the U.S. hotel industry was facing in the lead-up to the World Cup: New taxes and fees; international perception of visa delays; TSA wait times and funding uncertainty; room block cancelations; and increased gas and jet fuel prices.
U.S. President Donald Trump‘s immigration crackdown ensured that fans from four qualified nations (Haiti, Senegal, Iran and Ivory Coast) could not enter the country because of a travel ban. Furthermore, travelers from Algeria, Brazil, Cape Verde, Colombia, Egypt, Ghana, Jordan, Morocco, Tunisia, Uruguay and Uzbekistan have also been subjected to partial travel bans and visa freezes, with even some players and staff facing long immigration queues on entry to the country.
Uncertainty from FIFA has not helped either. After initially reserving large blocks of hotel rooms for designated FIFA staff, the organization eventually released around 95 percent of that inventory as those rooms were no longer needed. Around 2,000 rooms were canceled in Philadelphia alone, and up to 70 percent of room blocks were canceled in Boston, Dallas, Kansas City, Los Angeles and Seattle, leaving hoteliers little time to retrieve the bookings they missed out on earlier.
That confusion was particularly unhelpful for the New York City area, which FIFA estimated would welcome 1.2 million visitors during the tournament. But following disappointing demand, the Hotel Association of New York City halved its forecasts for hotel revenue growth to $100 million, and CEO Vijay Dandapani conceded that the city would be fortunate to attract even a third of the original projected visitor levels.
Mixed Picture As World Cup Began
The first 10 days of the World Cup produced a mixed picture in terms of booking and pricing dynamics for U.S. hotels, according to Wouter Geerts, director of market research at hospitality management software company Mews. The company is tracking the latest recorded data up to the World Cup final on July 19, basing its figures on a matched same-property sample to ensure year-on-year comparability, on both pre-event dates (January 1 through June 10) and group-stage dates.
In New York, the group stage opened with occupancy a percentage point below last year but rates up 24 percent as the city absorbed demand steadily. Forward bookings for the knockout rounds are tracking ahead of 2025 on both occupancy and pricing. With the final being played at MetLife Stadium nearby in East Rutherford, New Jersey, late-stage demand concentration is likely to push these numbers higher still.
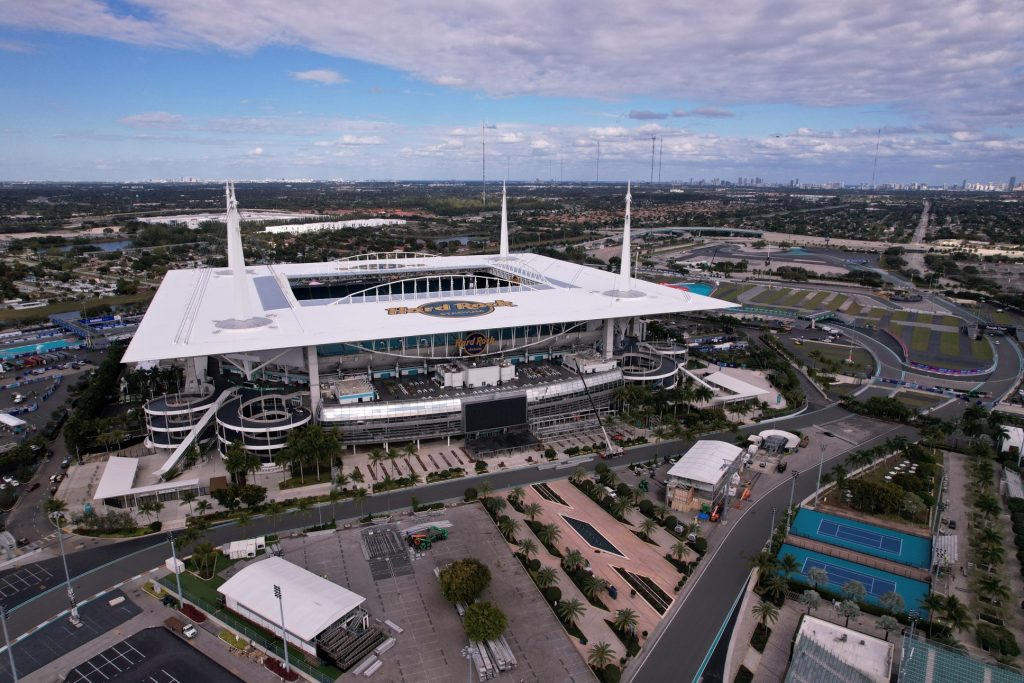
Miami was the most striking case study in Mews’ data. Occupancy spiraled 22 percentage points in the first 10 days of the World Cup versus last year — the result of aggressive rates set before the tournament. Hotels appeared to overcorrect on pricing, which suppressed advance bookings, with Average Daily Rates (ADRs) quickly dropping from highs of $3,882 to lows of circa $370. Occupancy is only just recovering to 2025 levels, with more late bookings expected as the city hosts matches into the semi-finals and third/fourth-place play-off.
Other markets are performing better where they have global tourism and hospitality infrastructure, as well as strong global connectivity, robust sports economies and/or significant soccer fanbases.
In Los Angeles, the opening 10 days of the World Cup saw ADR up 29 percent to the $354–$375 rate bracket with occupancy broadly flat — a consistent outcome for a market that hosted matches in the group stage and will do so again in the knockouts. Forward occupancy is modestly ahead of last year, and rate discipline is holding.
In Philadelphia, forward-looking occupancy was unexpectedly trending 18 percentage points ahead of last year, as of June 22. This is partly structural — Philadelphia hosted a later-stage knockout match between Paraguay and France on July 4, for example — and partly a continuation of the strong demand the city has seen so far this year.
The knockout rounds will be the real test for hotels in cities such as New York and Los Angeles, however, as last-minute ticket sales will be higher when fans discover where their national teams will qualify to play.
Booking patterns observed during the 2024 Olympic Summer Games in Paris provided a useful reference point when assessing booking trends for the 2026 FIFA World Cup. Mews compared hotel performance in Paris during those Games with the same period a year later, benchmarking against 2025 rather than 2023 because 2023 performance was still partially suppressed by the lingering effects of Covid.
During the Olympic period, Paris hotels recorded a nine percentage point increase in occupancy on the equivalent period in 2025, and an 82 percent increase in ADR. Outside of the Olympic window, though, average occupancy and ADR were around one percent below 2025 levels, which suggests that some leisure and business travelers deliberately avoided the city around the Games dates, leading to softer performance before and after the peak event period.
World Cup Hotel Impact So Far
To gauge the impact of the World Cup overall, Mews analyzed forward-looking hotel data from its customers in four key host cities — New York, Miami, Los Angeles and Philadelphia. It compared current reservations for June–July 2026 (on-the-books) with reservations at the same point last year for June—July 2025, using a matched same-property sample and a day-of-week-aligned baseline.
Demand in the weeks leading up to the tournament was relatively solid, as occupancy for World Cup dates was trending ahead of last year in three of the four selected host cities. However, when the World Cup began, the expected occupancy increases were either less than anticipated or failed to materialize in some cases.
Philadelphia stands out with a +16.7 percentage point increase in occupancy for World Cup dates, reflecting strong demand driven by the soccer showpiece, the city’s 250th anniversary celebrations as well as the MLB All Star Game that will take place later this month. On the other hand, New York (+8.5 percentage points), Los Angeles (+3.9 percentage points) and Miami (+1.8 percentage points) all showed steadier increases and more challenging demand pictures for the entire tournament overall, suggesting that demand has been disappointing and their pricing strategies have been more difficult to sustain as the competition progresses.
Of the four markets, Miami had the most aggressive pricing strategy by far, as World Cup ADRs went up 107 percent year-on-year. This is a dramatic increase, even compared to the already elevated levels in April (+148 percent).
New York and Los Angeles hoteliers have continued to ramp up their rates since April. New York’s World Cup ADRs are 36 percent above last year and Los Angeles’ figures are 28 percent up on 2025 levels; however, New York’s pre-event ADR of +12 percent was much higher than Los Angeles’ +1.5 percent increase due to the former’s strong baseline demand.
Elsewhere, Philadelphia has seen an ADR growth of +14 percent for World Cup dates, in line with its strong demand backdrop.
Pick-up (or how quickly rooms are being filled) has not been significantly faster than a normal, non-World Cup year. This highlights that the impact of the World Cup for hotels so far has been muted, and explains why hotels in all cities have been dropping prices due to disappointing demand.
Matches Driving Rates and Occupancy Levels
In the meantime, commercial real estate information company CoStar tracked how matches held in the U.S. and Canada in the first week of the FIFA World Cup were driving changes in occupancy levels, ADRs and RevPAR (Revenue Available Per Room, which measures a property’s ability to fill rooms at an average rate). The chart below tracks year-on-year ADR and occupancy changes in host cities on individual dates over that seven-day period.
It revealed that the majority of the 12 host cities studied had seen a positive uptick in occupancy, ADRs and RevPAR in the first week of the tournament. Kansas City was a notable standout on June 16, reporting the largest occupancy growth of 25 percent on the aligned data a year earlier, as well as an ADR rise of over 150 percent, coinciding with the Group J encounter between Argentina and Algeria (which brought waves of Argentine fans to that area).
That is despite Kansas City posting a year-on-year hotel occupancy decrease on June 20 — the same day Ecuador faced Curaçao at that location. Visit KC stated that hotel bookings over the 12-match period nights (pre / night of) were pacing up 32 percent over the corresponding 2025 dates in the weeks leading up the event start, despite FIFA’s room cancelations in the city.
While ADRs increased by a general range of 20 to 70 percent across all host cities, occupancy levels were more stunted as demand did not reach its anticipated peak. Two explanations for this occurrence could be that fans may have decided to stay in other neighboring markets or opted to stay in other lodging types to save costs.
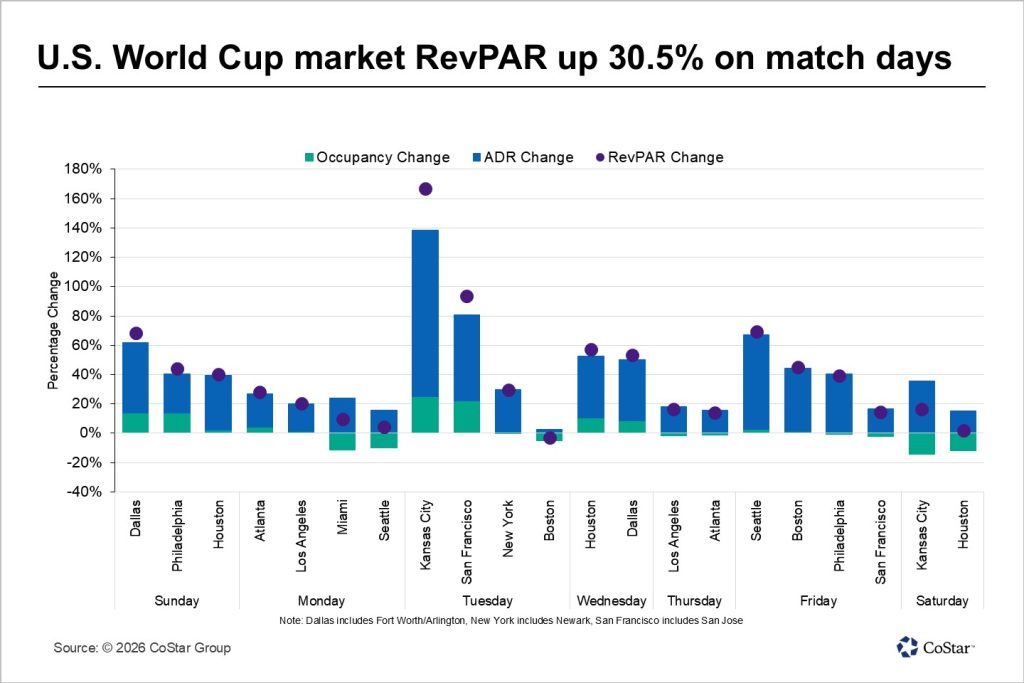
On the flip side, Miami and Seattle (June 15), Vancouver (June 18) and Houston (June 20) also all reported year-on-year occupancy decreases for the first week of the 2026 FIFA World Cup (as of June 22), compared to their corresponding dates a year earlier.
Vancouver comes under the most intense spotlight after reporting a near-50 percent occupancy drop-off on June 18 (compared to the same day last year) — the same day that host nation Canada played Qatar in the city. That would indicate that most of the home fans were not staying in hotels that night due to living locally or staying further away, or that there were not widespread hotel bookings from the Qatari fan contingent.
It is also well-documented that swaths of tickets were still on sale for matches during the first seven days of the tournament, due to both escalating prices or even a lack of enthusiasm for certain games. Tickets are more likely to sell out as the tournament progresses as the stakes get higher and fans try to capitalize on last-minute sales or price drops.
Short-Term Rental Performance
While hotels have seen mixed results in different markets, some markets saw a surge in short-term rentals. New York, Oakland (San Francisco Bay Area), San Francisco and San Jose/Palo Alto achieved consistently high short-term rental occupancy during the group stage, according to lodging data provider AirDNA‘s Short-Term Rental Performance Dashboard.
Intriguingly, the numbers appear to peak between June 18 and June 20, coinciding with matches involving Paraguay, Brazil and the United States. Short-term rental occupancy in the aforementioned cities surpassed 90 percent across those dates, while the Group D match between Paraguay and Türkiye on June 19 in the San Francisco Bay Area clearly led to a bookings surge in surrounding areas such as Oakland and San Jose/Palo Alto.
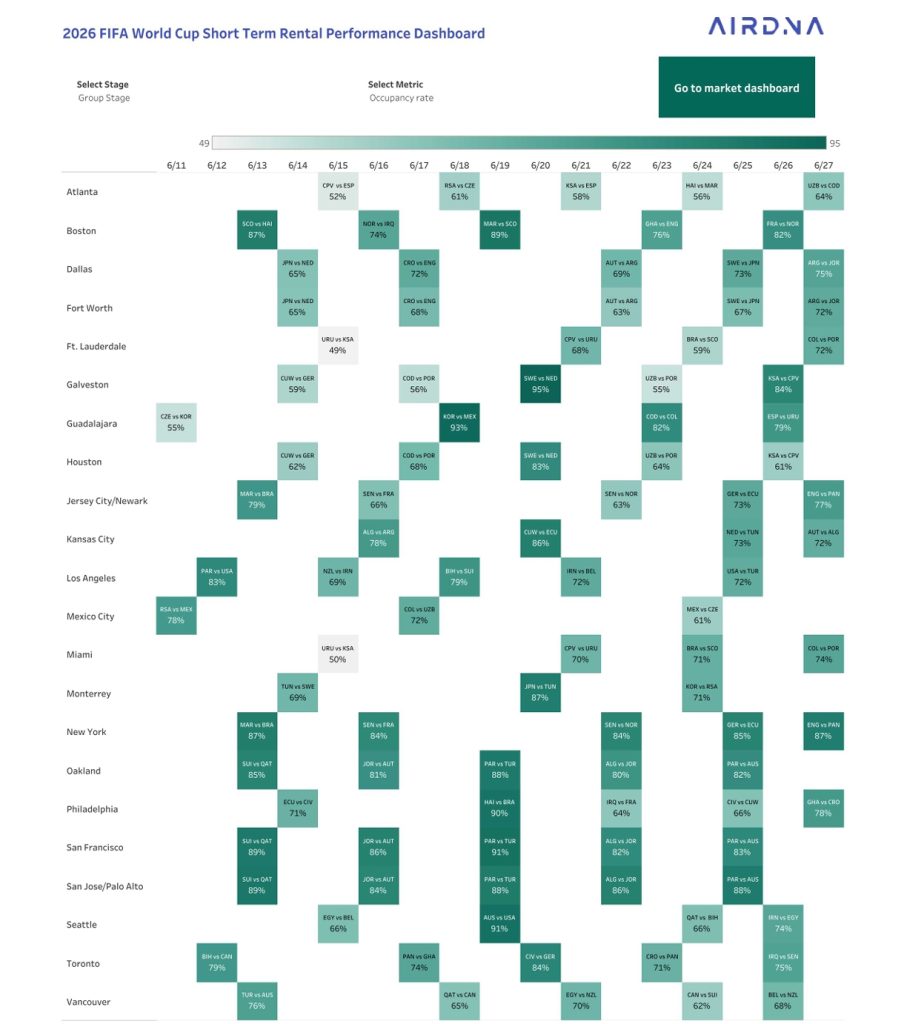
Miami, Fort Lauderdale, Dallas and Atlanta were among the weakest-performing markets across the World Cup group stage when it comes to short-term rentals, with occupancy generally averaging between 50 and 70 percent. The stunted occupancy levels could perhaps be attributed to lower-than-expected traveler demand or a heightened preference for other lodging types like hotels over short-term rentals.
Posted in: 2026 FIFA World Cup, Feature Story, Hosts & Suppliers, Latest News, Main Feature, Sites & Venues, Soccer